[01]
UNIFIED PIPELINE
// PILLAR_UNIFIED
Metrics, traces, and logs resolve through one OpenTelemetry-native pipeline rather than separate collection agents.
Monitor metrics, traces, logs, and alerts from a unified workspace. OpenTelemetry-native, with deep filtering and correlation to pin down issues fast.— REAL SIGNALS SURFACE.
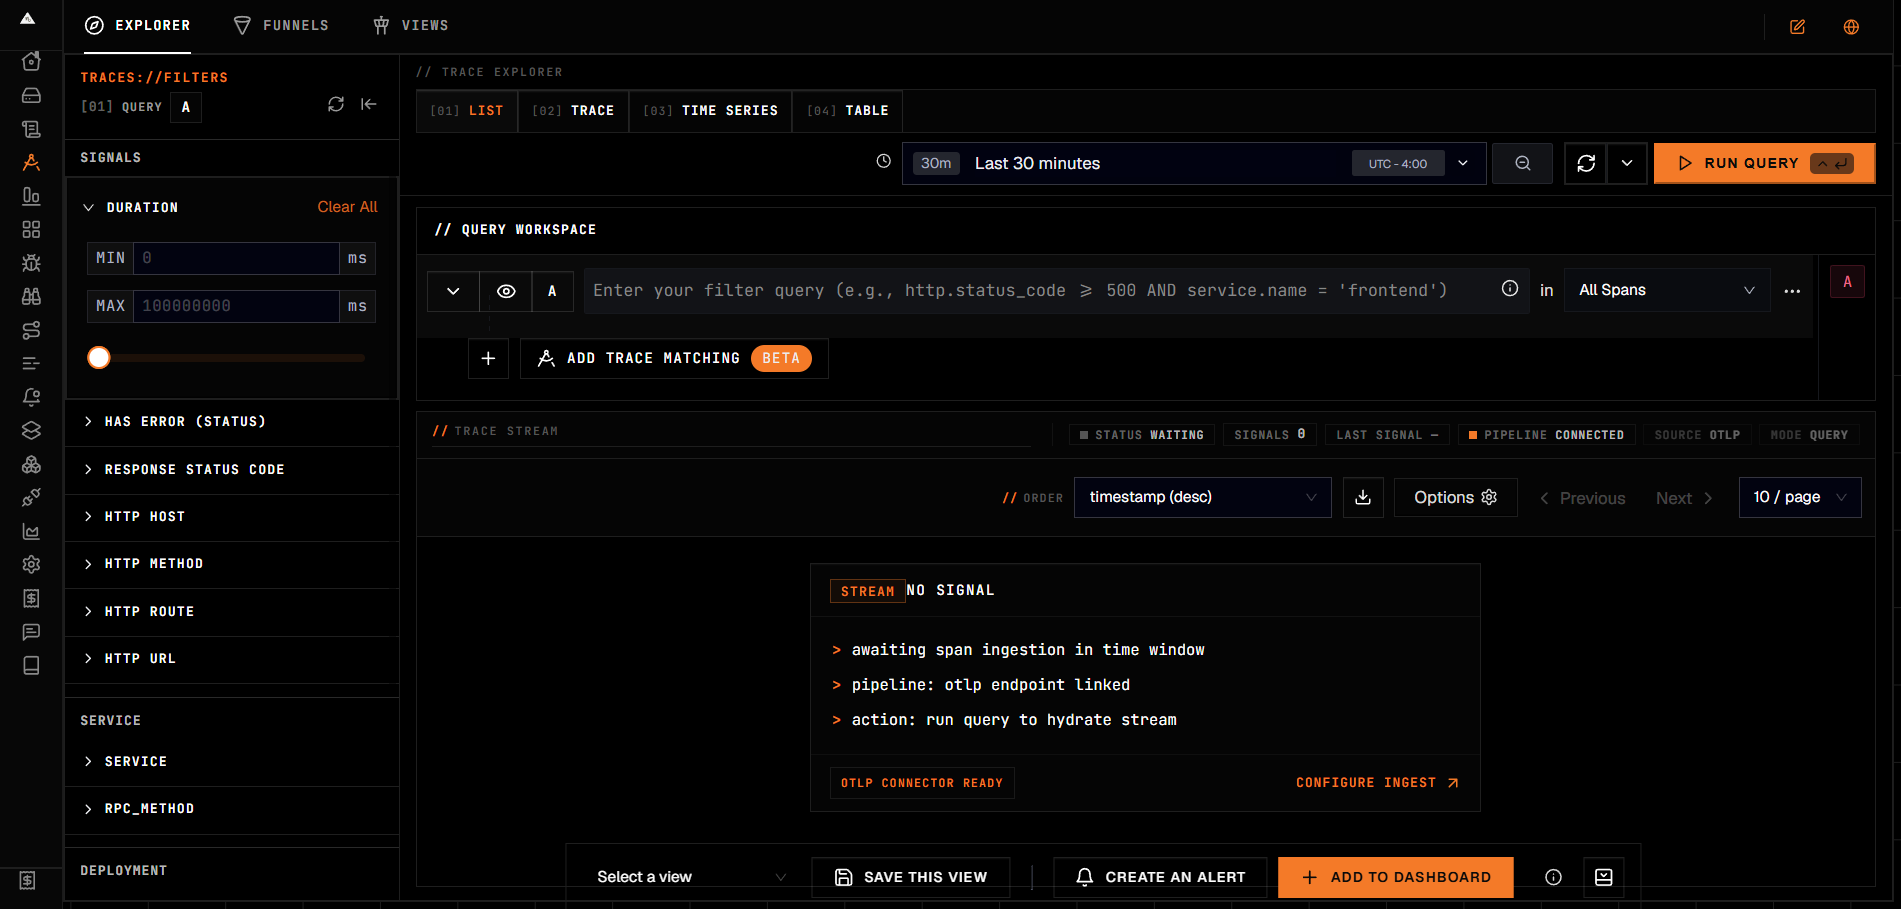
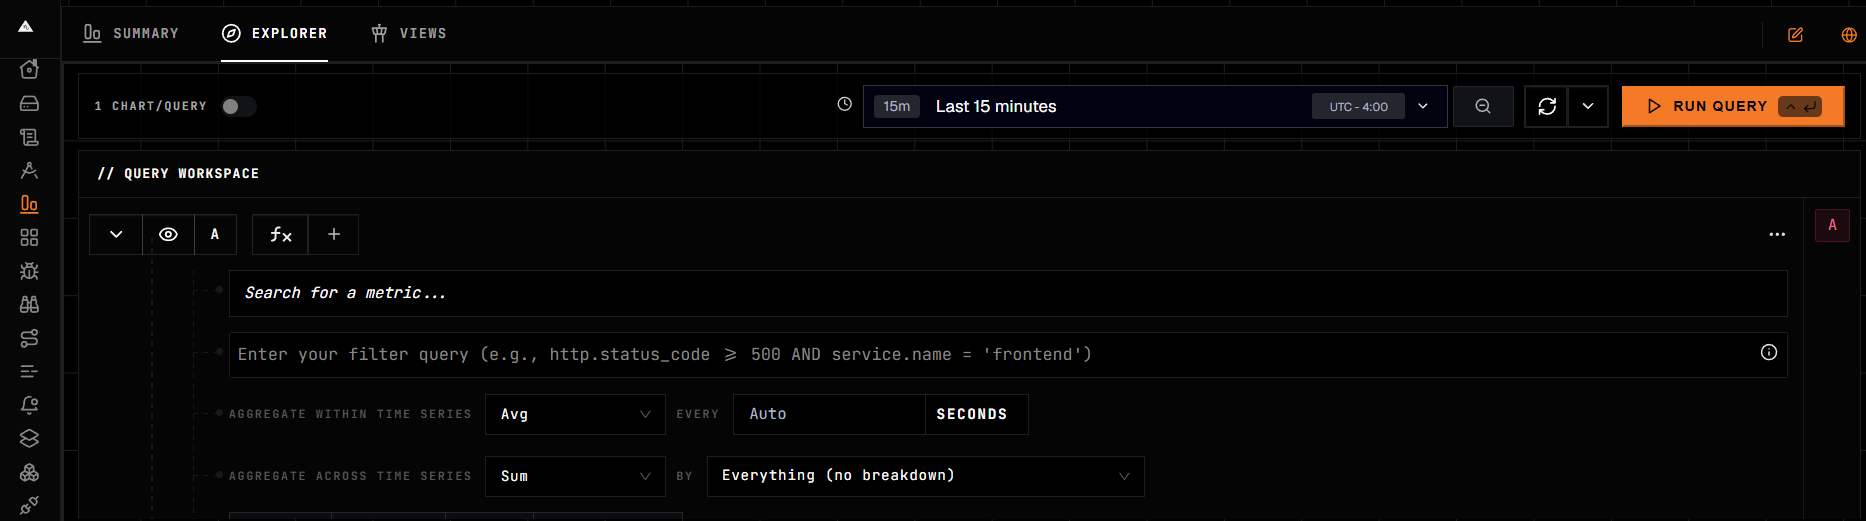
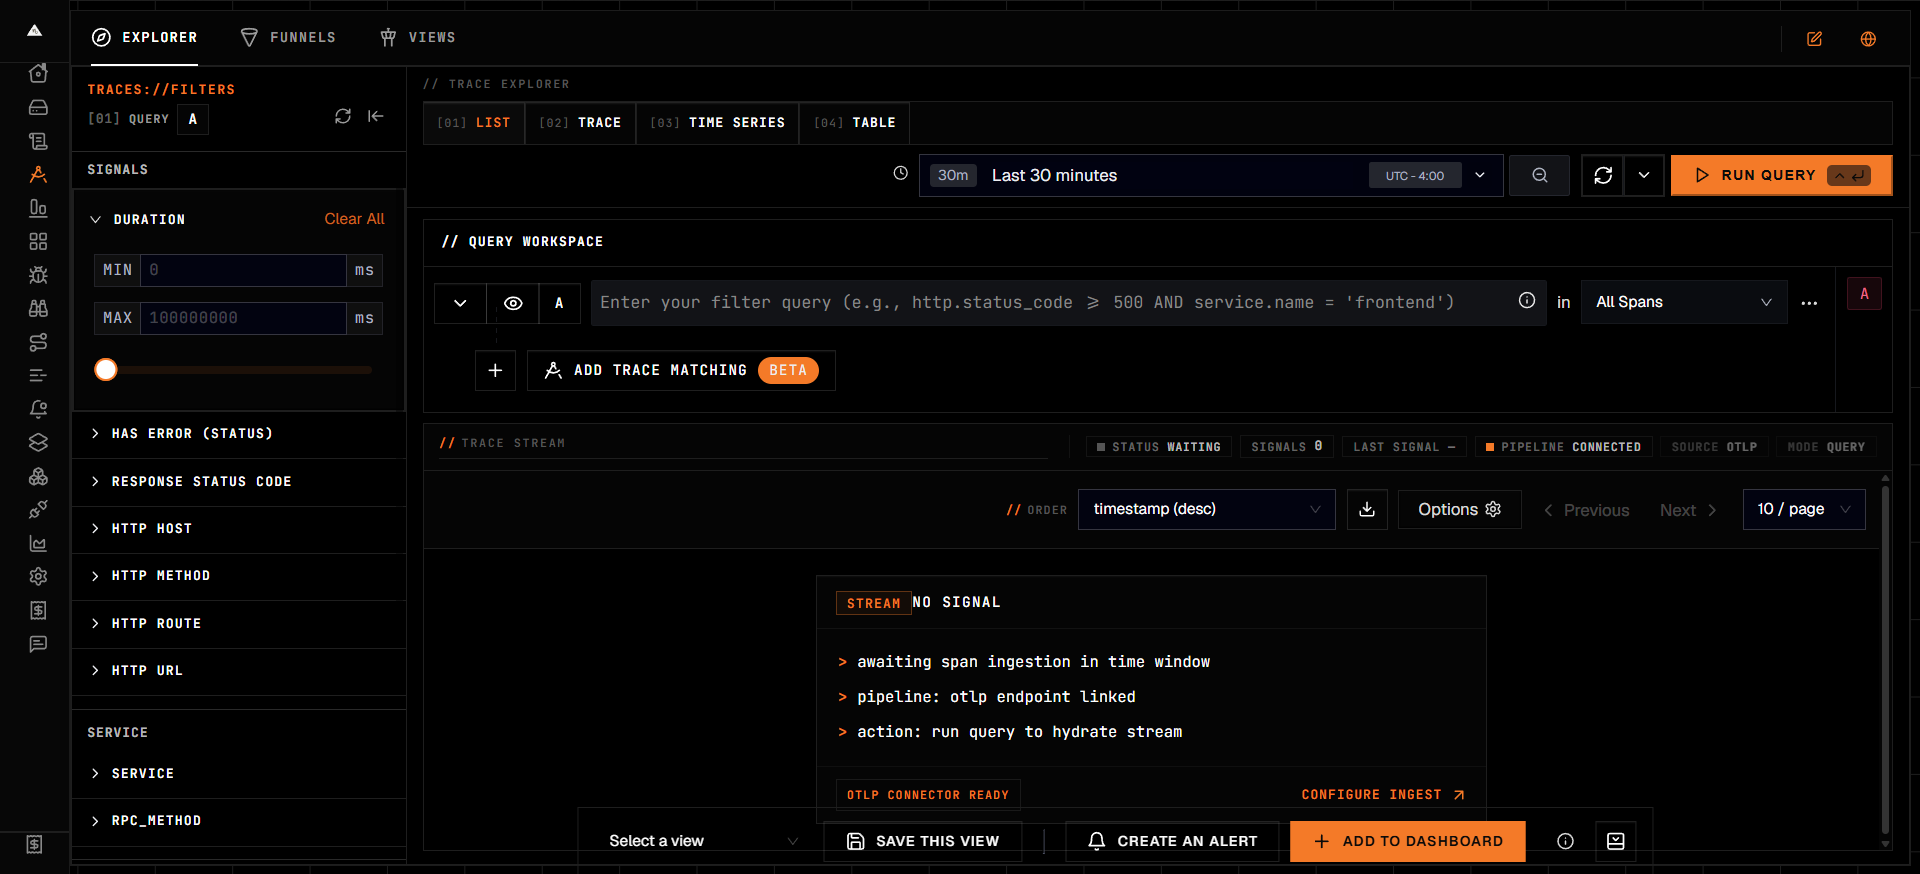
Unified ingestion for metrics, traces, and logs over OpenTelemetry.
OTEL_SDK // COLLECTOR // OTLPMetrics, traces, and logs resolve through one OpenTelemetry-native pipeline rather than separate collection agents.
All telemetry signals share the same ingestion, storage, and query path with zero vendor lock-in.
Spans, logs, and metrics are correlated by trace ID, so investigation reads as one continuous diagnostic sequence.
Every signal type inherits the same retention policy, query interface, and access controls across the platform.
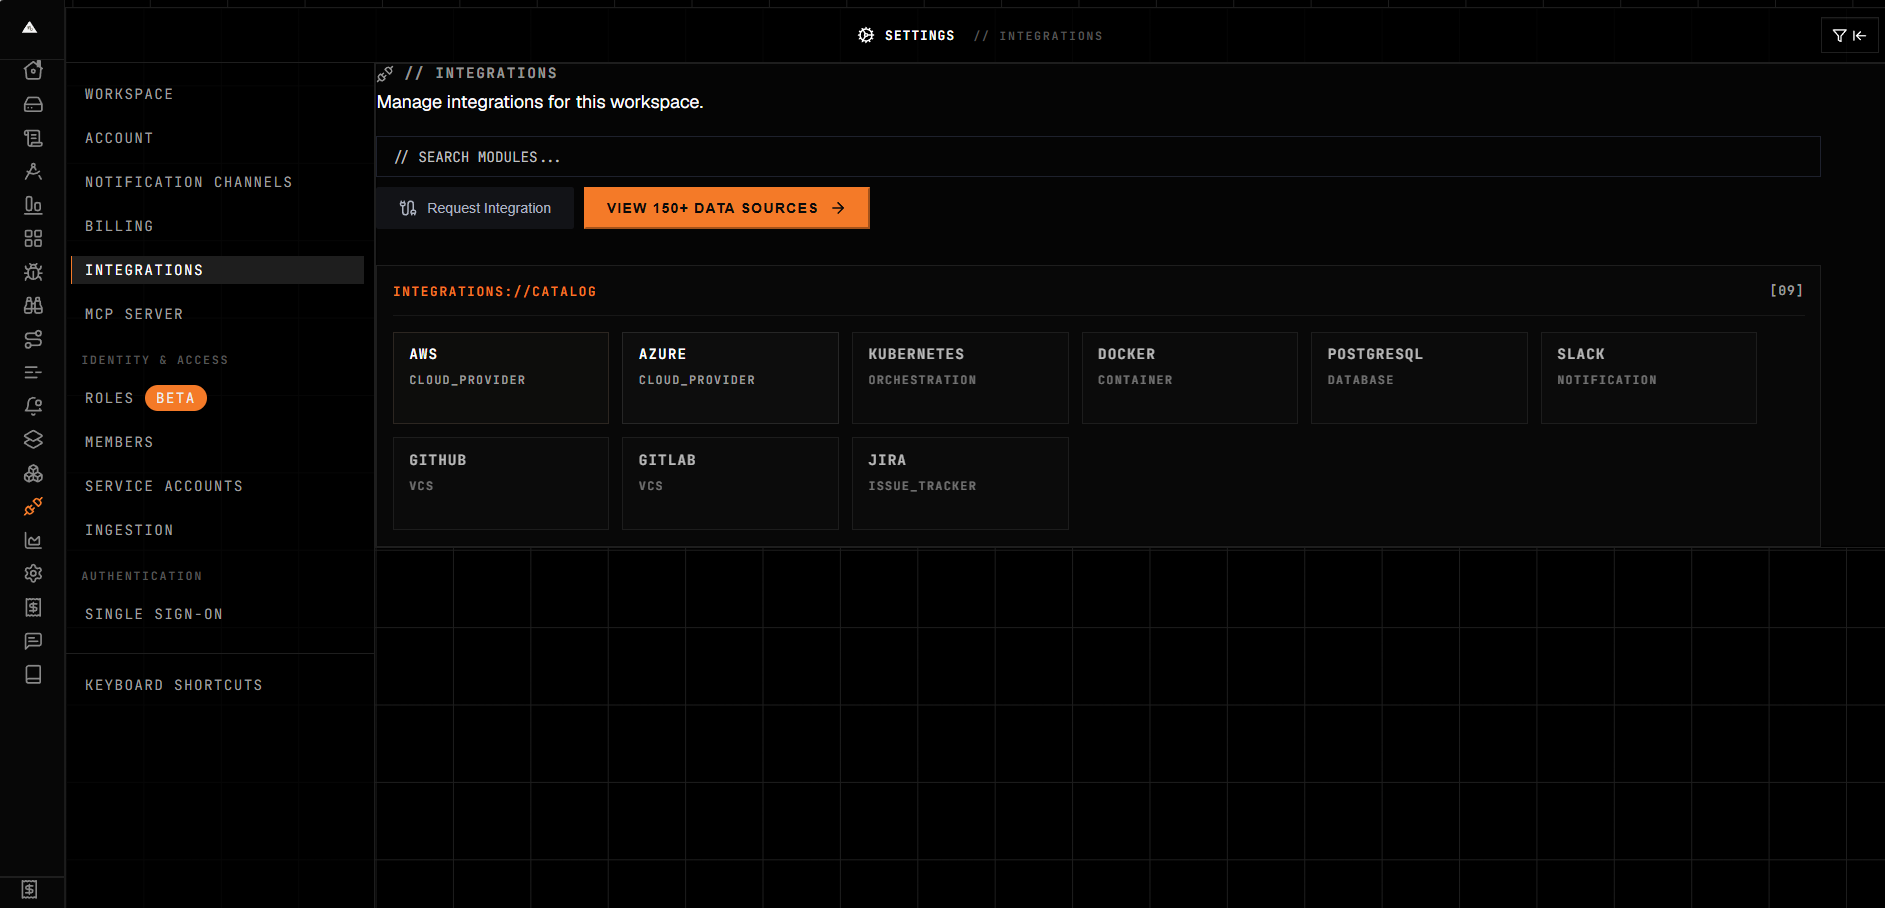
Stable endpoints expose query, ingest, and dashboard APIs directly, so integrations never drift against documentation.
OpenTelemetry SDKs bind language runtimes to the ingest pipeline, where every span and metric is fully inspectable.
The OpenTelemetry Collector validates, transforms, and routes telemetry at the edge before it reaches the backend.
NOIR AI deploys on Kubernetes or Docker Compose and scales to billions of data points with proven production continuity.
endpoint
/api/v3/query_range
signal
metrics
latency
84ms
Telemetry_Stream
© 2026 Noir Stack LLC // OPEN-SOURCE OBSERVABILITY
BUILT_FOR_PRECISION // REAL_SIGNALS_SURFACE